1
Upload Your Photos
Upload 6 clear photos of your face securely and privately through our online portal.
Drag and drop file To upload
POSES REQUIRED


The facial index, also called the face height-to-width ratio in clinical anthropometry, is the ratio of vertical face height (nasion to gnathion) divided by bizygomatic width. Anthropologists use it to sort faces into leptoprosopic (tall, narrow), mesoprosopic (oval, average), or euryprosopic (broad, short). That category drives a lot of orthodontic and aesthetic planning.
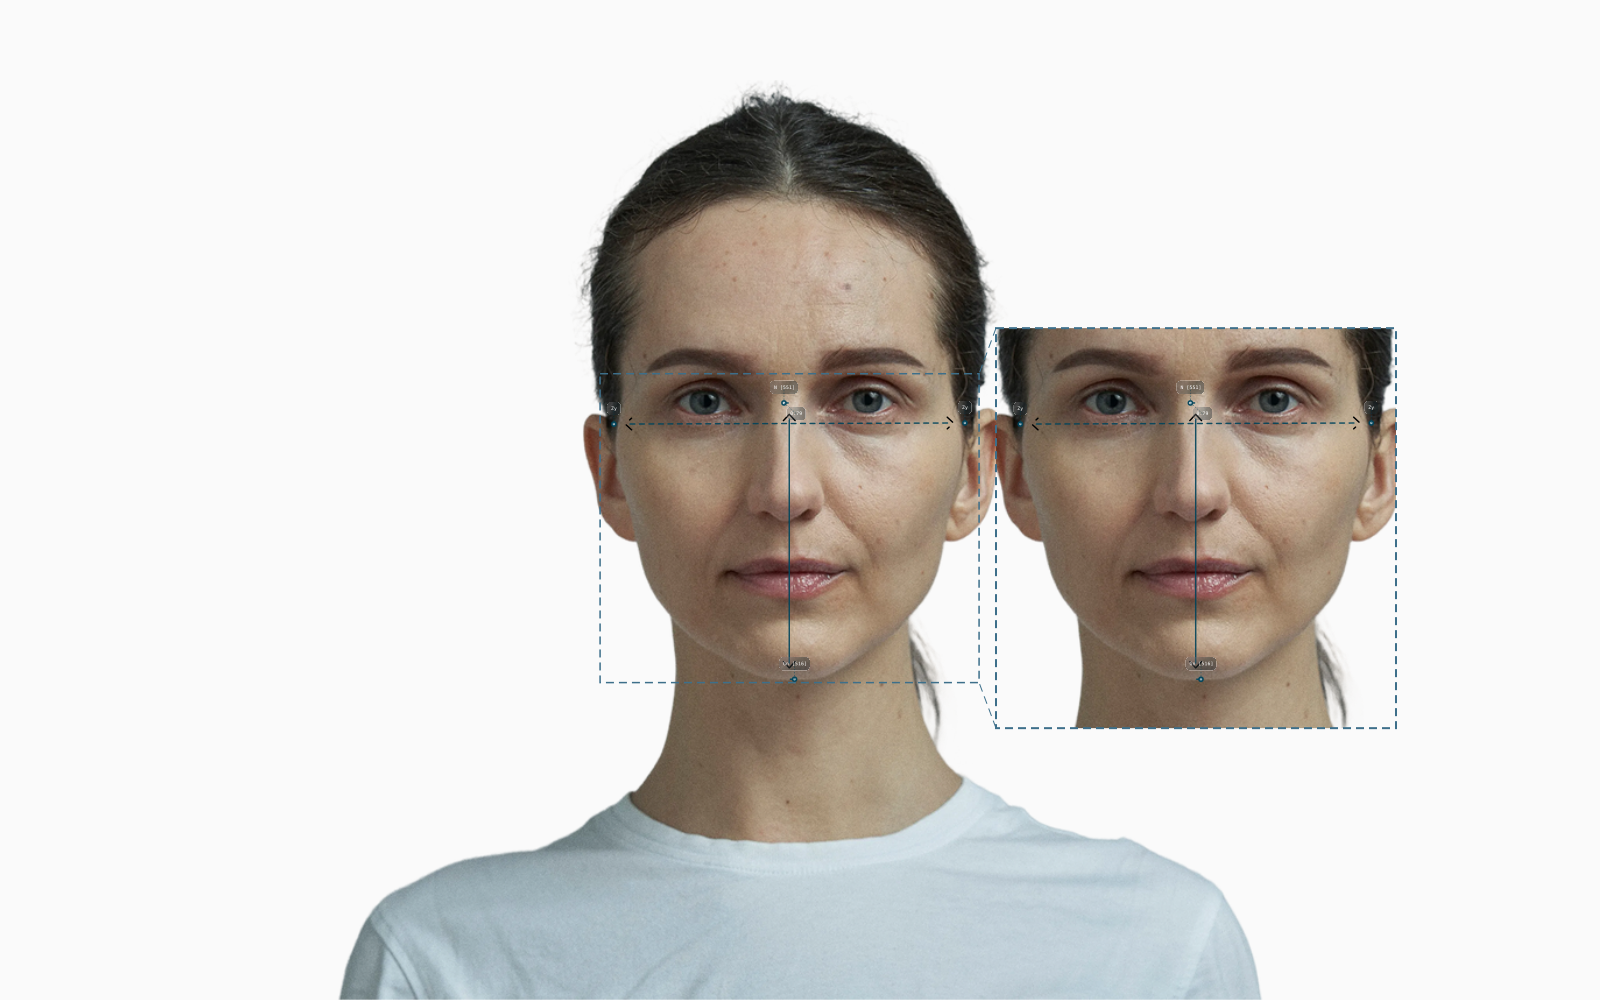
How It's Measured
The facial index is calculated on a frontal photo. You take the vertical distance from nasion (N) to gnathion (Gn), divide it by the horizontal bizygomatic width (Zy to Zy), and multiply by 100. The formula has not changed since Garson and Martin codified it in the early 20th century (Naini, 2014).
The Frankfort horizontal plane is the reference for keeping the head level. Without it, even a small upward or downward tilt inflates or shrinks the facial index (Kalantar Motamedi et al., 2015). Modern facial analysis software pulls the four landmarks from a single standardised frontal photo and computes the ratio in milliseconds, which is faster and more reproducible than physical calipers on the face.

Left: the original front-facing photo. Right: the same person with a longer, narrower face. The facial index goes from 0.88 to 1.01, and nothing else in the photo changed.
Why It Matters
The facial index is the single number that decides which face shape category a person falls into. The classification has five bands. Garson published the male values in 1923, Martin and Saller the female values shortly after, and the bands have barely moved since: hyper-euryprosopic (very broad, short), euryprosopic, mesoprosopic (average oval), leptoprosopic (tall, narrow), and hyper-leptoprosopic (Naini, 2014). A face with the same eyes, lips, and chin reads completely differently depending on which band it sits in, because the index sets the frame everything else is judged inside.
Population norms shift this picture. Korean adults cluster heavily in the hypereuryprosopic band, with roughly three out of four CBCT-scanned subjects measuring below 80% (Park et al., 2024). North American Caucasian samples sit closer to mesoprosopic at 88 to 94% (Farkas et al., 1985). Treating one population's mean as a universal ideal misreads everyone outside that reference.
Surgically the facial index also matters because it sets the ceiling on what orthognathic and chin procedures can deliver. A genioplasty that lengthens the chin shifts gnathion downward, which raises the index and pushes a euryprosopic face toward mesoprosopic. Vertical reduction does the opposite, walking a leptoprosopic face back toward the oval mean. Knowing which band a face starts in separates a planned correction from an over-correction that strands the patient outside their own phenotype (Naini, 2014).
The stat-cards below show the typical adult ranges. The demographic table after that breaks the index down by population so you can read your own value against the right reference.
84–88
Men (mesoprosopic)
81–85
Women (mesoprosopic)
78–93
Typical Adult Range
These values vary depending on individual facial structure and background.
Demographic Variants
Ideal facial index values vary by population. The same index can read as a long, narrow face in one demographic and an average oval in another, which is why orthodontic and surgical planning leans on population-specific norms. Each row below links to the canonical paper that established the band for that group.
Demographic | Ideal range | Source |
|---|---|---|
North American Caucasian (men) | 88–93 (mesoprosopic / leptoprosopic) | |
North American Caucasian (women) | 85–89 (mesoprosopic / leptoprosopic) | |
Korean (mixed sex) | under 80 in roughly 75% of adults (hypereuryprosopic) | |
Persian (adolescent, mixed sex) | approximately 88–92 (mesoprosopic, with broader lower face) | |
Afro-American (young adult) | clusters lower than Caucasian norms; broader, shorter face dominant | |
Nigerian (adult, mixed sex) | euryprosopic-leaning; lower index than Iranian and Caucasian samples |
Upload 6 clear photos of your face securely and privately through our online portal.
Drag and drop file To upload
POSES REQUIRED
We measure 160+ facial markers, including skin quality, symmetry, eye shape, brow density, and more.


You’ll receive a plan highlighting your strengths, areas for improvement, and best ways to improve your appearance.
Emma’s Report
January 16, 2026
Explanation
Your forehead wrinkle depth aligns with expectations for your age and demographic, falling on the lower end of our predicted range.
Your Questions
A normal facial index sits between roughly 78 and 93 in adults. The mesoprosopic (average oval) band runs 84.0 to 87.9 for men and 81.0 to 84.9 for women per the canonical Garson and Martin and Saller tables (Naini, 2014). North American Caucasian samples cluster near the upper end of mesoprosopic and into leptoprosopic (Farkas et al., 1985), while East Asian samples typically read lower. There is no single global ideal. The right reference depends on the population the face belongs to.
The facial index is measured from a standardised frontal photograph held in the Frankfort horizontal plane. The vertical distance from nasion (where the nasal bones meet the forehead) to gnathion (the lowest point of the chin) is divided by the bizygomatic width between the two zygions, then multiplied by 100 to give a percentage. Modern facial analysis software derives the value from landmark coordinates rather than physical calipers, which is faster and more reproducible (Kalantar Motamedi et al., 2015).
These are the three core categories of the prosopic classification. Leptoprosopic means tall and narrow (index 88.0–92.9 in men, 85.0–89.9 in women). Mesoprosopic is the average oval face (84.0–87.9 in men, 81.0–84.9 in women). Euryprosopic is broad and short (79.0–83.9 in men, 77.0–80.9 in women) (Naini, 2014). The extreme bands above and below (hyper-leptoprosopic above 93, hyper-euryprosopic below 79) capture the outliers and matter most in orthognathic planning.
The facial index and the facial width-to-height ratio (FWHR) measure different things on the face. The facial index uses the full vertical height from nasion to gnathion over bizygomatic width, so it captures the entire face. FWHR uses only the upper-face height from the upper lip to the brow line over bizygomatic width, so it captures the central rectangle (Naini, 2014). The facial index drives prosopic classification and orthognathic planning. FWHR is the one studied for testosterone and perceived dominance in men.
Attractiveness studies tend to favour the mesoprosopic (oval) band, which sits at the population mean for most groups and overlaps with the averageness preference documented across cultures (Bahrami Najafabadi et al., 2025). Leptoprosopic faces read as longer and more refined. Strongly euryprosopic faces read as rounder and softer. None of these is objectively unattractive. The safer reading is that the most attractive facial index is the one closest to your own population's mesoprosopic mean.