1
Upload Your Photos
Upload 6 clear photos of your face securely and privately through our online portal.
Drag and drop file To upload
POSES REQUIRED


FWHR, short for Facial Width-to-Height Ratio, is a single number that captures how wide a face reads relative to its upper height. The ratio compares bizygomatic width (cheekbone to cheekbone) against the distance from the brow line to the upper lip. Researchers track it because it correlates with testosterone, perceived masculinity, and dominance ratings in adult men.
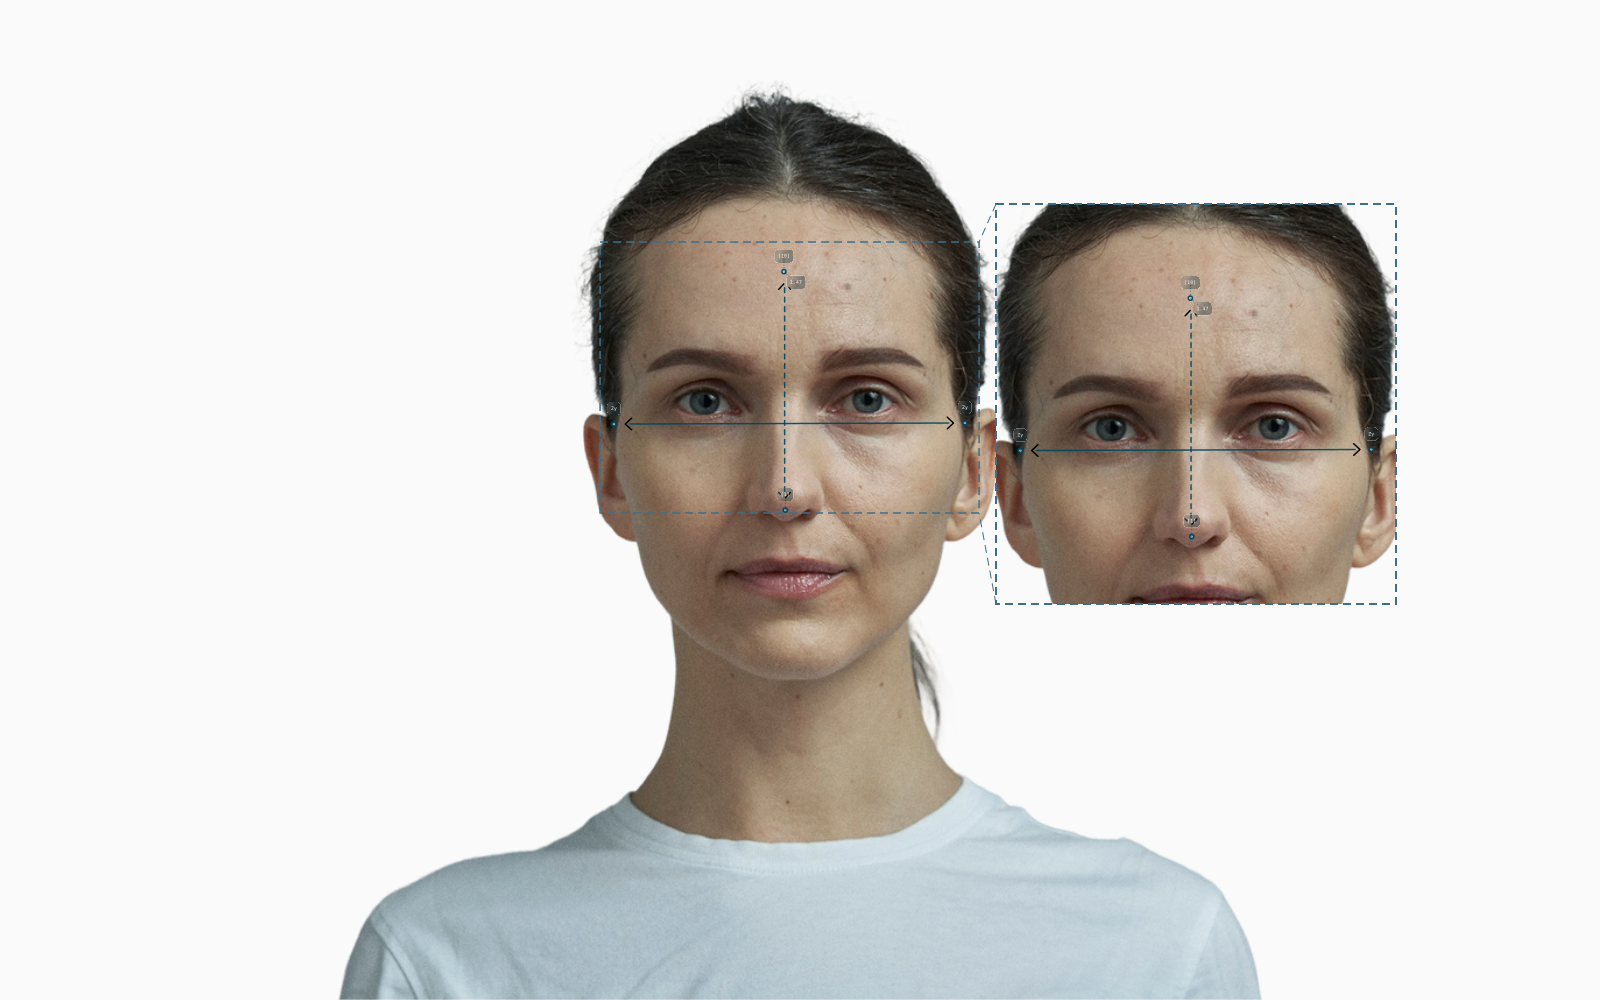
FWHR is one of the simplest facial ratios in the literature. You divide the width of the face at the cheekbones by the height of the upper face from the brow line down to the upper lip. The number that falls out, usually between 1.7 and 2.1 in adults, summarises how wide-and-short or narrow-and-long a face reads from the front (Lefevre et al., 2013).
The convention was formalised by Carré and McCormick (2008). They were studying whether facial structure could predict aggression in men, and they wanted a metric that ignored chin and jaw length, which finish growing later than the upper face. Most modern FWHR studies still follow their landmark protocol.

Left: the original front-facing photo. Right: the same person with a wider midface. The facial width-to-height ratio goes from 1.48 to 1.62, and nothing else in the photo changed.
FWHR caught researchers' attention because it does something unusual for a single facial ratio: it tracks circulating testosterone in adult men (Lefevre et al., 2013). Men with higher FWHR scored higher on baseline testosterone in two independent samples, and the ratio also rose with reactive testosterone after exposure to potential mates. That makes FWHR closer to a hormonal readout than to a static proportion like the golden ratio.
The Facial Width-to-Height Ratio matters for perception in two opposing ways. Within male faces, a higher ratio reads as more dominant and more aggressive (Carré and McCormick, 2008), but also as less trustworthy and slightly less attractive (Stirrat and Perrett, 2010). Observers rate these traits reliably from photographs alone, which is why FWHR turns up in studies of CEOs, hockey players, and speed-dating outcomes. The signal is small but consistent across cultures.
There is a separate caution. The original sexual-dimorphism finding (men have higher FWHR than women) has been challenged by larger samples that find no significant difference between adult men and women (Kordsmeyer et al., 2019). The difference shows up cleanly in upper-face height at puberty (Weston et al., 2007), but the ratio itself can wash out depending on how the landmarks are placed. The stat-cards and demographic table below show the ranges that survive that scrutiny.
Ideal FWHR varies more by measurement protocol than by population. Studies that place the upper-lip landmark on labrale superius produce slightly lower ratios than those that use stomion, so the bands below should be read as protocol-specific.
Demographic | Typical FWHR range | Source |
|---|---|---|
Adult men (large mixed-sample) | 1.7–2.1 | |
Adult women (large mixed-sample) | 1.7–2.0 | |
University hockey players (high-aggression sample) | 1.9–2.2 | |
Mixed adult sample (geometric-morphometric method) | 1.7–2.0 |
Upload 6 clear photos of your face securely and privately through our online portal.
Drag and drop file To upload
POSES REQUIRED
We measure 160+ facial markers, including skin quality, symmetry, eye shape, brow density, and more.


You’ll receive a plan highlighting your strengths, areas for improvement, and best ways to improve your appearance.
Emma’s Report
January 16, 2026
Explanation
Your forehead wrinkle depth aligns with expectations for your age and demographic, falling on the lower end of our predicted range.
Your Questions
There is no single ideal FWHR. Adults of both sexes typically sit between 1.7 and 2.0, and ratios in this band read as neutral to most observers. Higher values, around 2.0 to 2.2, are linked to higher testosterone and stronger dominance ratings in men (Lefevre et al., 2013), but those same ratios trade off against perceived trustworthiness and attractiveness (Stirrat and Perrett, 2010). What counts as good depends on the trait you are optimising for.
FWHR is bizygomatic width divided by upper-face height. Take a square-on frontal photo, mark the two zygions (the most lateral points on the cheekbones), and measure the horizontal distance between them. Then mark the lowest point of the brow and the upper lip, and measure the vertical distance. The standard protocol from Carré and McCormick, 2008 uses labrale superius as the lower landmark and the brow line as the upper, ignoring the chin entirely.
A high FWHR, roughly 2.0 and above, signals a wider face for a given upper height. In men it correlates with higher baseline testosterone, higher self- and other-rated aggression, and more competitive behaviour in laboratory tasks (Carré and McCormick, 2008). The same morphology is read as less trustworthy by observers, though, so the effect is double-edged.
Early studies argued FWHR was sexually dimorphic, but later work with larger samples has not replicated that result. Kordsmeyer et al., 2019 and other recent papers find no significant FWHR difference between adult men and women once landmark placement is standardised. The cleanest sex difference at puberty is in upper-face height itself, not in the ratio (Weston et al., 2007).
FWHR predicts perceived masculinity and aggression in men reliably across studies, but the effect sizes are modest. The original aggression finding from Carré and McCormick, 2008 has replicated in some samples and failed to replicate in others (Wang et al., 2017). Treat it as a small, real signal rather than a deterministic one. The link to testosterone is more robust than the link to behaviour itself.