1
Upload Your Photos
Upload 6 clear photos of your face securely and privately through our online portal.
Drag and drop file To upload
POSES REQUIRED


The facial thirds, also known as the rule of thirds in the Vitruvian canon and the midface ratio in clinical literature, are the three vertical regions a side-profile face divides into between the hairline and the chin. They anchor how proportionate the face reads at a glance and underpin treatment planning across rhinoplasty, orthognathic surgery and chin augmentation.
How It's Measured
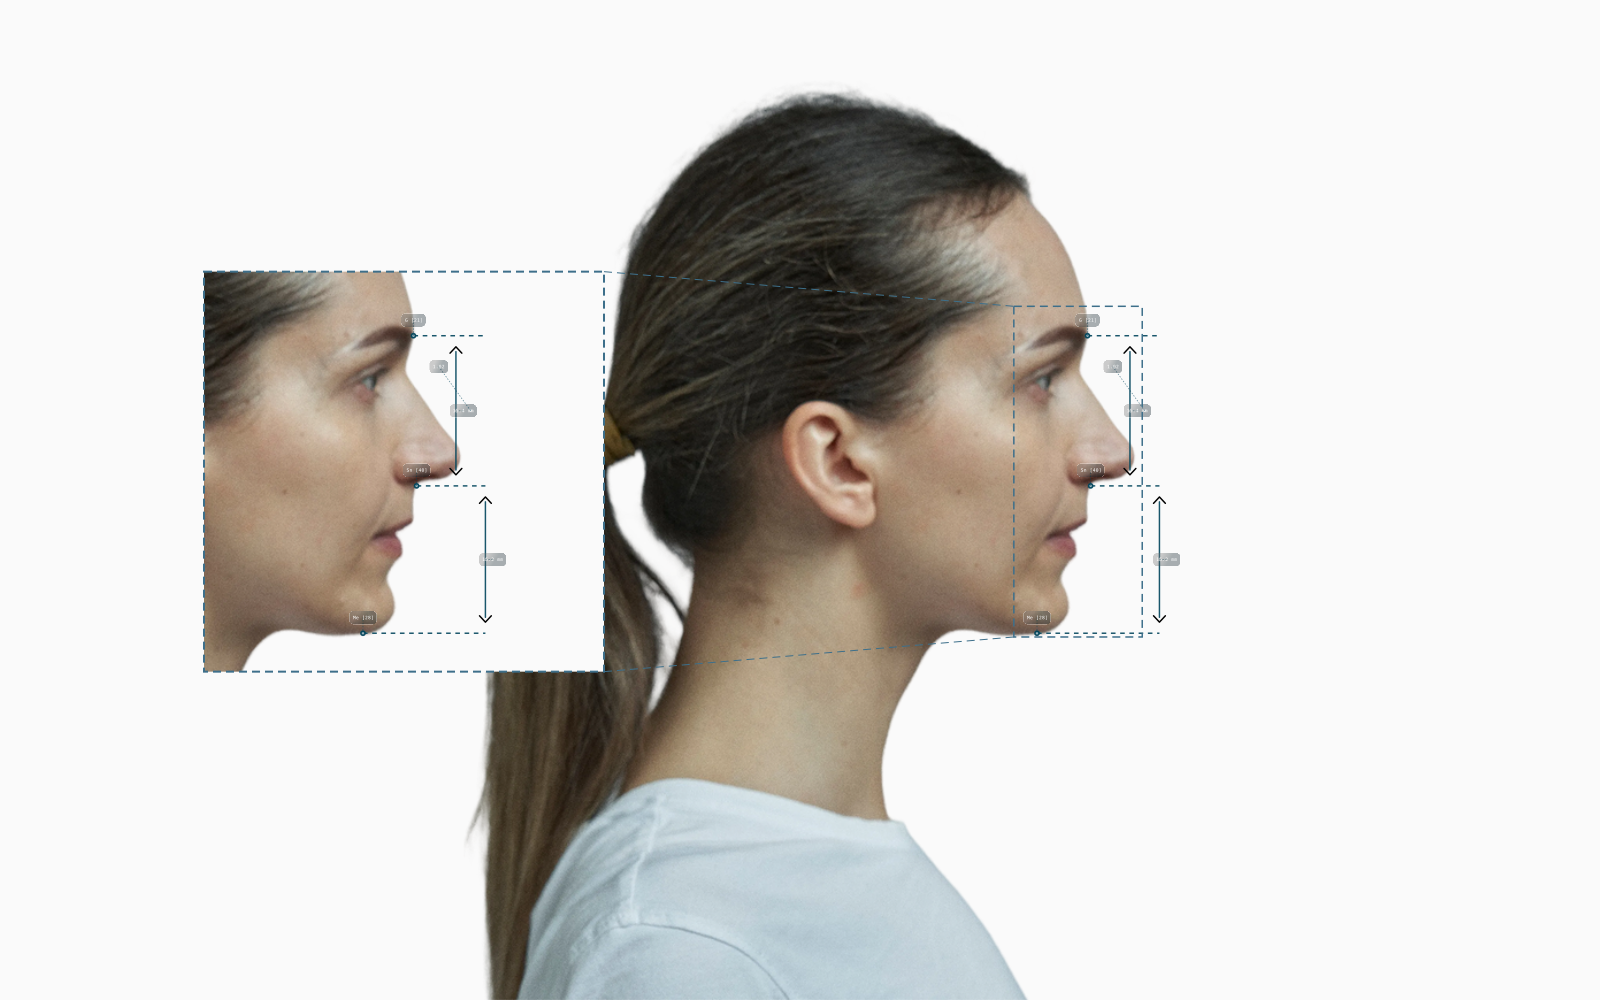
Facial thirds are read on a side-profile photograph by marking three soft-tissue landmarks along the midline of the face and dividing the segment between them into three vertical bands (Powell & Naini, 2011). Each band traces a region of the face that develops on its own clock, so the same total face height can land on very different proportions.
The Vitruvian canon assumes all three are equal in height, but modern anthropometric work shows healthy faces sit close to that ratio without strictly matching it (Farkas et al., 1985).

Left: the original front-facing photo. Right: the same person with a taller upper face. The upper facial third goes from 52.7 mm to 62.4 mm and the lower third from 57.0 mm to 53.4 mm, and nothing else in the photo changed.
Why It Matters
Of the three bands, the lower third is where a face most often falls out of balance and where surgery has the most leverage. A lower third that sits noticeably longer than the middle reads as a long face; a noticeably shorter one reads as a short or rounded face. Both shift the centre of gravity of the profile and change how the chin, lips and nose register against the rest of the head (Powell & Naini, 2011). Clinicians treat the lower-third length as the single most informative vertical landmark for treatment planning in dentofacial surgery and prosthodontics.
The aesthetic reading is not symmetric. In one perceptual study, faces with a slightly reduced lower third were rated more attractive than the same face with a lengthened lower third (Mazaheri et al., 2018). The implication for the patient is real: a long lower third is the proportion that most often drives requests for chin reduction or maxillary intrusion, while a slightly short lower third reads as youthful rather than imbalanced.
Equal-thirds is a Western ideal, not a universal one. Around 91% of Arabian men and 88% of women in one large sample carried a lower third that exceeded the middle third, mirroring the same direction of mismatch Farkas documented in North American whites and African Americans (Al Taki et al., 2015). Quantitative ratio work across Asian and Caucasian samples confirms the same point: significant proportional differences exist between sex and ethnicity, so a single global target misreads non-Caucasian profiles (Zheng et al., 2022). The numbers in the stat-cards and table below are population means, not personal goals.
Skip ahead to the typical ranges and the demographic table if you want the values; the visual above shows how the bands sit on a real face.
1.00–1.05
Men (middle:lower)
0.95–1.05
Women (middle:lower)
0.95–1.05
Typical Range
These values vary depending on individual facial structure, sex and ethnic background; see the table below for population-specific ranges.
Demographic Variants
The Vitruvian equal-thirds canon was built on idealised Greco-Roman sculpture and matches few real populations. Modern anthropometric samples consistently show the lower third running longer than the middle, with the magnitude varying by ancestry and sex.
Demographic | Ideal range (middle:lower) | Source | Profile |
|---|---|---|---|
Caucasian men | 1.00–1.02 (lower third slightly longer) | — | |
Caucasian women | 1.00 (near-equal middle and lower) | — | |
African American adults | 0.93–0.97 (lower third clearly longer) | — | |
East Asian adults | 0.97–1.02 (middle third slightly fuller in women) | — | |
Arabian Peninsula adults | 0.88–0.93 (lower third about 10% longer than middle) | — |
Upload 6 clear photos of your face securely and privately through our online portal.
Drag and drop file To upload
POSES REQUIRED
We measure 160+ facial markers, including skin quality, symmetry, eye shape, brow density, and more.


You’ll receive a plan highlighting your strengths, areas for improvement, and best ways to improve your appearance.
Emma’s Report
January 16, 2026
Explanation
Your forehead wrinkle depth aligns with expectations for your age and demographic, falling on the lower end of our predicted range.
Your Questions
The classical answer is a 1:1:1 ratio across the upper, middle and lower thirds, popularised by Leonardo da Vinci's reading of the Vitruvian canon (Powell & Naini, 2011). Real adult faces sit close to that target rather than matching it: in Farkas's North American Caucasian sample the middle and lower thirds were within 1 to 2 mm of each other on the average face, with the lower third 9 mm longer than the middle in 68% of subjects (Farkas et al., 1985). A healthy range to aim for is a middle:lower ratio between 0.95 and 1.05; outside that band the face starts to read as long or short, depending on which third is dominant.
On a side-profile photograph, drop a horizontal line at three soft-tissue points along the midline: trichion (the hairline), glabella (the bump between the brows), subnasale (where the nose meets the upper lip), and soft-tissue menton (the bottom of the chin). Measure the vertical distance between each consecutive pair in pixels or millimetres (Powell & Naini, 2011). The upper third runs trichion to glabella, middle runs glabella to subnasale, lower runs subnasale to menton. The headline metric clinicians and patients track is the middle-to-lower ratio, since the upper third is often hidden by the hairline in modern photos and contributes the least to the visual reading of the lower face.
Usually no. People asking this question are more often noticing a long lower third rather than a long middle third, since lower-third dominance is what most non-Caucasian samples show on average (Al Taki et al., 2015). A genuinely long middle third (glabella to subnasale clearly outpacing the lower band) is much rarer and usually points to either a low-set hairline making the upper third small by contrast, or true midfacial vertical excess from skeletal development. The cleanest way to tell which one you have is to measure both bands rather than judging by eye: faces shorten visually when the lower third is longer, even when the midface is normal.
A long lower third caused by skeletal vertical maxillary excess is corrected with maxillary impaction via Le Fort I osteotomy, often combined with a bony genioplasty to set the chin back vertically (Powell & Naini, 2011). When the issue is isolated chin length rather than full maxillary excess, vertical-reduction genioplasty alone can shorten the chin segment without touching the rest of the face (Sykes et al., 2019). Soft-tissue options (chin filler, masseter Botox) won't change vertical length and aren't substitutes for either bony procedure when the underlying skeleton is the source.
Yes, but less than the eyes, nose and lips do. Vertical face height is set by the skeleton and changes little after late adolescence, while soft-tissue volume in the cheeks, eyelids and lower face shifts as collagen, fat pads and skin elasticity decline (Canons of facial beauty, 2023). The visible effect is that the bands themselves stay roughly the same length but the chin and jaw can appear longer or more defined as the surrounding soft tissue deflates. Tooth wear and edentulism in older adults can reduce the lower third by a few millimetres, which is the only common age-driven change in raw thirds geometry.